PoreMapper: Python package for mapping molecular pores
A quick and easy way to make blobs and pores
An update!
A new version of PoreMapper is available on pip with some minor changes to the API. See the latest gists or the PoreMapper examples for usage.
Why?
I work mostly with metal-organic cages and, in that field, the pore is often visualised with a software called VOIDOO (see here), which makes very pretty images. I wanted to recreate that, quickly (just for visualisation) and in Python (to interface with an stk molecule). I initially planned on performing cheap dynamics on what I termed a Blob inside the cage, allowing it to mould to the interior surface. However, that was overcomplicating the issue. Instead, just inflate a balloon inside the pore!
An example usage that highlights “why” is available as part of my YouTube tutorials:
How?
I will start by noting that a lot of the more frustrating parts of this code were taken directly for pyWindow, which was developed by Marcin Miklitz during his time in the Jelfs group. I thank him for saving me some time! Additionally, I must thank Austin Mroz, a postdoc in the Jelfs group, who shared with me the atomic radii from their recent work: STREUSEL (paper here). These radii are used for all Atoms in the Host class.
PoreMapper provides a Host class, which reads in XYZ coordinates and atom types: this is the cage of interest. The calculation is handled by the Inflater class, which takes only one argument: the bead_sigma or radius of the Beads that will be used to map the pore (i.e., resolution). The Inflater has two methods: get_inflated_blob and inflate_blob, which perform the same process, except get_inflated_blob only yields the final result, not each step.
The process begins with a Blob made up of Beads in an idealised spherical geometry with radius of 0.1 Angstrom and a number of beads defined by the size of the Host. The Blob is placed at the centroid of the Host. Over 100 steps, the position of each Bead in the Blob is translated outwards in small increments until the maximum diameter of the Host is reached. If at any point a Bead is within contact distance (bead radii + atom radii) of a Host atom, it is no longer moved in following steps and added to the Pore class (a subset of beads in the initial Blob). The output of the calculation is an InflationResult, which contains the Blob and Pore for futher analysis.
A Blob provides pathways out of the molecule, which we analyse, by clustering the points (MeanShift usage from sklearn), to find the windows of the Host. This process is currently limited (see below) and pyWindow is recommended! Regardless, the visualisation of the pathways, and collection of those coordinates, may be useful. This figure shows the inflation of the blob in CC3:

A Pore provides a visualisation of the inside of Host and the class provides analyses including get_mean/max_distance_to_com for pore radii, get_volume for pore volume and get_asphericity for pore shape. Again, the key for me was visualisation. This figure shows the inflation of the pore in CC3:

Most importantly, PoreMapper is easy to use in a Python project! Here is a code example of running an analysis of a host from an XYZ file:
import pore_mapper as pm

# Read in host from xyz file.
host = pm.Host.init_from_xyz_file(path=f'{name}.xyz')
host = host.with_centroid([0., 0., 0.])

# Define calculator object.
calculator = pm.Inflater(bead_sigma=1.0, centroid=host.get_centroid())

# Run calculator on host object, analysing output.
final_result = calculator.get_inflated_blob(host=host)

# Analysis.
windows = final_result.pore.get_windows()
print(f'windows: {windows}, pore_volume: {pore.get_volume()}')

# Write final structure.
host.write_xyz_file(f'{name}_final.xyz')
final_result.pore.get_blob().write_xyz_file(f'{name}_blob_final.xyz')
final_result.pore.write_xyz_file(f'{name}_pore_final.xyz')
And from an stk.Molecule:
import pore_mapper as pm
import stk

# Define some stk molecule.
cage = stk.ConstructedMolecule(...)
# OR
cage = stk.BuildingBlock(...)

# Convert to Host.
host = pm.Host(
    atoms=(
        pm.Atom(id=i.get_id(), element_string=i.__class__.__name__)
        for i in cage.get_atoms()
    ),
    position_matrix=cage.get_position_matrix(),
)

# Define calculator object.
calculator = pm.Inflater(bead_sigma=1.0, centroid=host.get_centroid())

# Run calculator on host object, analysing output.
final_result = calculator.get_inflated_blob(host=host)

# Analysis.
...
Examples and limitations.
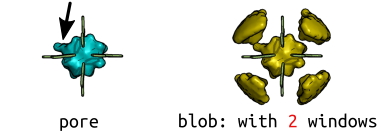
A Blob provides pathways out of the molecule, and from these points, we provide window clustering/detection. However, the window calculation is the most costly part currently, and is not perfect. The figure below shows a metal-organic cage with four windows, where PoreMapper detects two. Additionally, you can see (black arrow) that the Pore has some imperfections based on beads being outside of the cavity.

The figure below shows some more examples of pores and blobs (purple on the right; all others have equivalent blobs and pores because there are no windows!) for multiple metal-organic cages. Importantly, to produce the coordinate files for this analysis takes a couple of seconds! Although I could spend ages making the figures pretty in pymol…

On the left, we see multiple cages with no windows, the one on the right is entirely nonporous. The volumes calculated for the first three are within ~200 Angstrom^3 of reported VOIDOO volumes (a paper on this), but I would suggest that changes in bead diameter and resolution could be the cause of this (warning of the sensitivity).
What next?
It is available on GitHub and can be installed through pip!
A series of examples are provided here. This package is small and after spending a short amount of time writing it and being very happy with the outcome, for visualisation at least, I decided that merging it with pyWindow (more code from the Jelfs group: pyWindow) would be best. This would include rewrite/clean-up/improvements/bug-fixes to pyWindow, which I hope to report on soon!
Please, test it, use it, break it and send me feedback!
